Find out about the neighborhood from the comfort of your office
A Geonomics report provides you the intelligence to make critical decisions. Whether it’s selecting a business location, making a real estate investment, or managing risk, our census maps and report will improve your chances of success.
Using the 2020 US census data and subsequent refinements made by ESRI, Geonomics has converted lifeless census tables into a rich series of demographic maps. Focusing on a single address, detailed maps tell the true story of every neighbourhood in the United States. This report includes:
- Detailed Lifestyle Analysis
- Real Estate Value Predictions
- Crime reports by address
- Population Demographics
- Income and Home Values


Mapped Demographics by Street Address
Crime levels, net worth, real estate trends, ethnicity and household income are some of the parameters presented in a series of color-coded maps based on census block groups. In addition, Tapestry Lifestyle Segments are mapped with a detailed description provided for the address and all the surrounding areas. Every Geonomics map is centered on the address of interest. The complete report will give you insights that are not available in any other product.

Understand the EnvironmenT
The number one cause of failure in any endeavour is ignorance of the underlying problems. Census maps give the full picture. Real estate values combined with net worth and income can tell you the economic condition of the neighbourhood and reveal long-term prospects.
Profile the exact neighborhood and the surrounding area

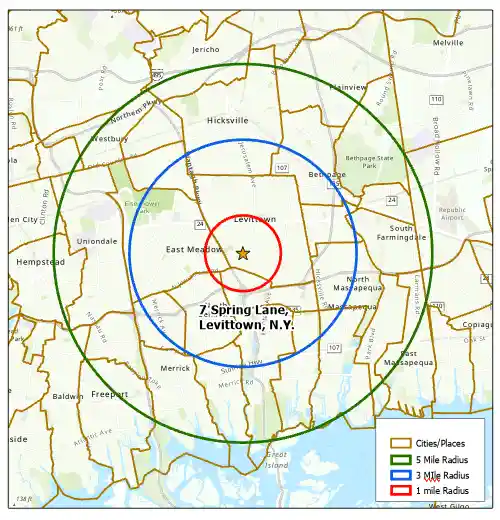
THE 5 MILE RULE
Have you heard of the 5 Mile Rule? It is a proven fact that your business will depend on the population within a 5mile radius. If your population within 5 miles is small compared to other locations in the area, that is not the place to locate your business.
A Geonomics census map will give the 1, 3 and 5-mile radius population numbers to use as a guideline.
IDENTIFY AREAS THAT ARE SAFE AND WILL SEE STRONG REAL ESTATE GAINS
If you are purchasing a rental property, remember that no one wants to live in a crime-ridden neighborhood, whatever the rent may be. Geonomics provides crime reports by address. The same report also shows the 5-year real estate value trends. Looking at the crime statistics, ethnic diversity and the 5-year real estate value projections, you can find an investment that could double in value in the near future.


LIFE STYLE SEGMENTATION
Housing Market Data
The mantra of savvy real estate investors is that profit is made during the acquisition of the property, not the sale. The 5-year value projections in every Geonomics report provides key information for real estate investment. Percentage of renters, rental rates and the 2022 value estimates are all provided. Whether your investment target is commercial buildings, multi-family housing or single-family homes, aGeonomics report can help you make the right decision.
- Home Values
- Projected Home Values in 5 years
- Year Housing Build
- Owner vs. Renter
- Vacancy Rate
- Number of Housing Units
- Poverty Status

POPULATION DEMOGRAPHICS:
- Age
- Ethnic Diversity
- Income
- Household size
- Number of Households
- Male vs. Female
USING DEMOGRAPHIC DATA FOR CRITICAL DECISION
Businesses and individuals can make critical decisions more effectively if they are able to visualize demographic data in census maps. The only way to understand that context is by using intelligent maps. A Geonomics reports uses Geographic Information System (GIS) technology to create maps and population demographic reports that provide the context needed for critical decisions.

What is the Science of Geonomics?
Geographic Information Systems + Economics = Geonomics
Location-based analysis based on the latest US Census Data
Detailed maps that support business-critical decisions
Census results
ranked
by US standings
WHAT WILL YOUR REPORT LOOK LIKE?
- EDUCATION
- INCOME
- POVERTY LEVELS
- RENTER VS. OWNER
- REAL ESTATE VALUE
- CRIME REPORTS BY ADDRESS
- WEALTH
- LIFESTYLE SEGMENTATION
- ETHNIC BREAKDOWN
Mapped data reports from Geonomics are intended for both businesses and individuals. On the Geonomics.US website, you can request a free sample report for that has been created for Bourbon Street, New Orleans, Louisiana. Your report will contain the same information for the street address that you need. To get your report, you don’t need to talk to a salesperson or anyone else. Just go to our website, put in your order and the address you are need, and your report will be delivered by email to you in a few minutes. Whether you need the latest information on +housing, population, market segment, income, age, building age, or crime, we cover every neighborhood address in America.

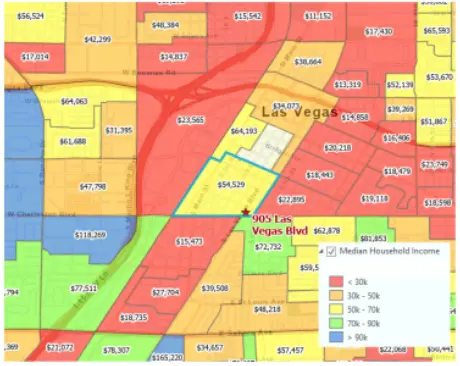
DETAILED NEIGHBORHOOD MAPS OF INCOME
A Geonomics report provides census maps of income but that’s not the whole story. Net worth is also a key to the puzzle. A neighborhood of young adults that work in the tech industry and pay rent can have very high income but still have a low net worth. A neighborhood of seniors that own their homes but are retired can have a low household income but a very high net worth. Depending on what your business is, this is critical information that could be the difference between success and failure.
Income Levels in Downtown Las Vegas
US RANKING FOR MEDIAN HOUSEHOLD INCOME: 32
US RANKING DISPOSABLE INCOME: 32
US RANKING FOR POVERTY
(HIGHER NUMBER = MORE POVERTY): 95
DETAILED NEIGHBORHOOD MAPS OF REAL ESTATE VALUE
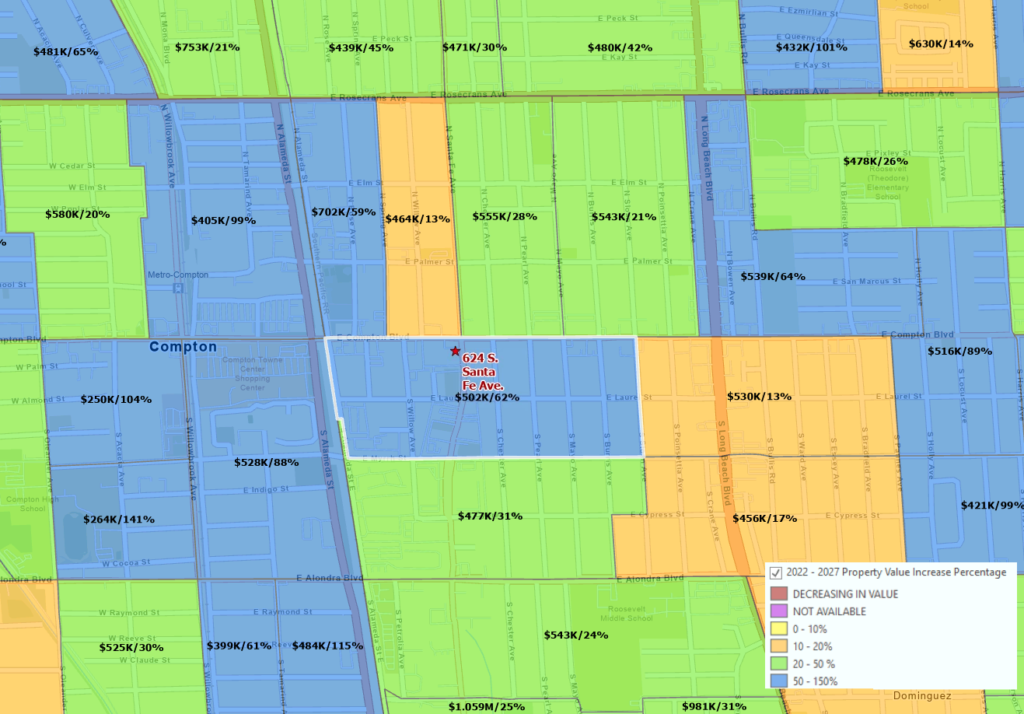
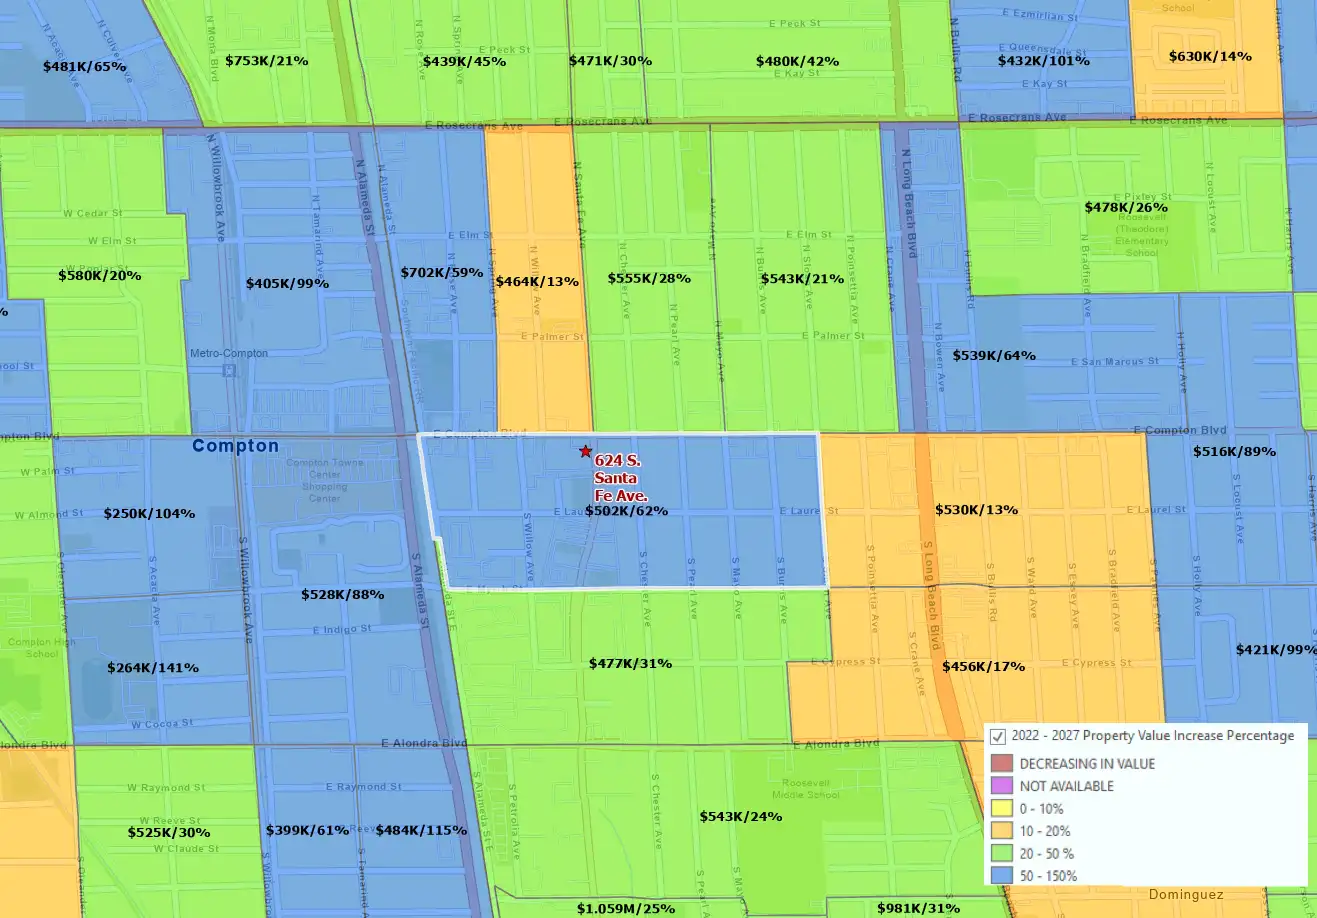
PROJECTED REAL ESTATE VALUES IN 5 YEARS
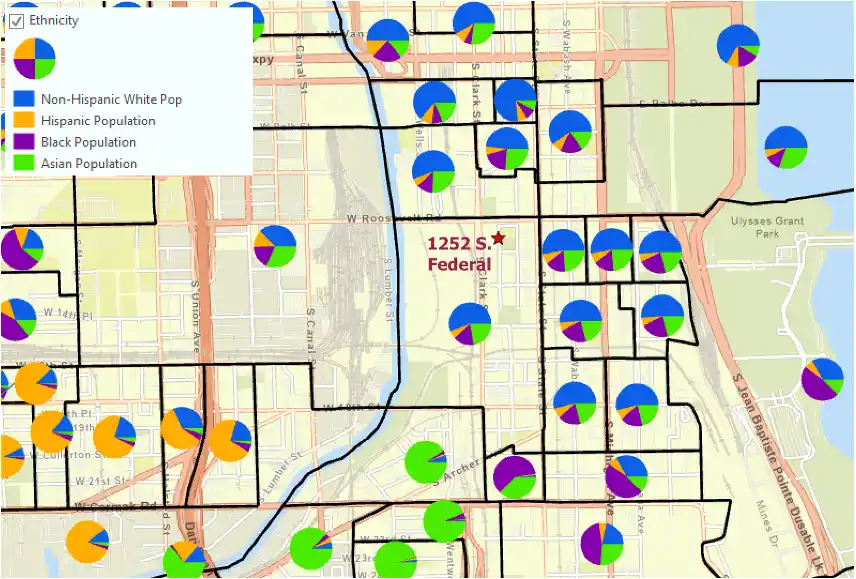
MAPS OF ETHNIC DIVERSITY
A diverse neighborhood can be the key to business success. A Geonomics report breaks down the ethnic mix of every neighborhood with easy-to-understand pie charts for every block group. Each neighborhood is broken down by percentage of white, black, Hispanic and Asian. This methodology gives a clear view of the ethnic breakdown for every neighborhood in the area.
Ethnic Distribution in Downtown Chicago
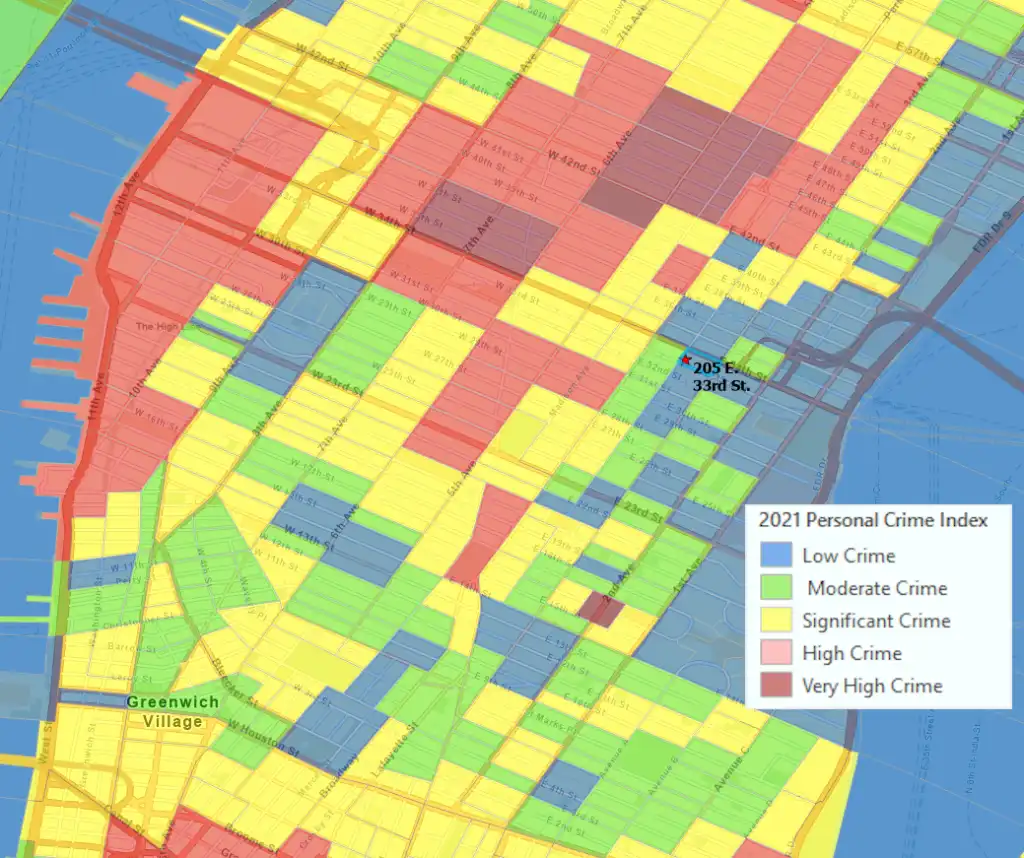
US RANKING PERSONAL CRIME INDEX (HIGHER RANKING = MORE CRIME) 26
US RANKING PROPERTY CRIME: 71
US RANKING TOTAL CRIME: 67
MAPS OF LIFESTYLE SEGMENTATION
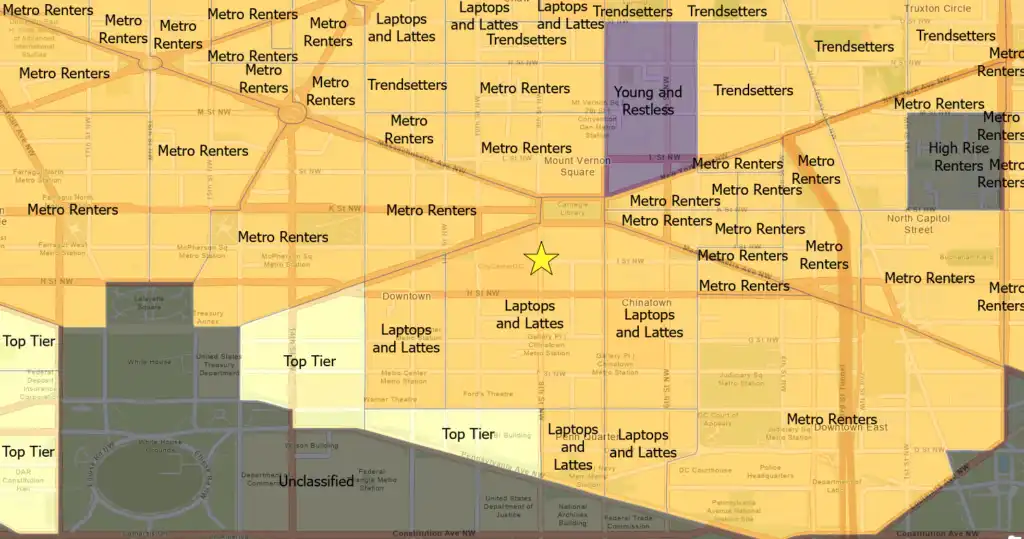
Detailed Lifestyle Description of the Target Area
Laptops and Lattes = Residents are predominately single, well-educated professionals in business, finance, legal, computer and entertainment occupations. They are affluent and partial to city living and its amenities. Neighborhoods are densely populated and primarily located in the cities of large metropolitan areas. Many residents are single and are focused on their careers and financial accomplishments.
UNDERSTAND YOUR LOCATION
Franchise Companies
Real Estate Developers
Insurance Companies
Mortgage Brokers
Site Selection Consultants
Companies Looking to Expand
Commercial Realtors
Sales Consultants
Residential Realtors
Property Managers
GET YOUR NEIGHBORHOOD REPORT
Data for each address is based on the 2020 Census Block Group Area

30 Day Subscription
- Unlimited Reports for 30 Days
- Run Unlimited reports for 30 days for only US Address
90 Day Subscription
- Unlimited Reports for 90 Days
- Run Unlimited reports for 90 days for only US Address
One year Subscription
- Unlimited Reports for one year
- Run Unlimited reports for one year for only US Address
Request a Sample Report
Money Back Guarantee
About Geonomics
Geonomics has taken the results of the 2020 Census and ESRI’s updated population demographics and combined them into a report that gives you everything you need to know about a neighbourhood. Critical decisions can be made confidently, knowing that you understand the area and the residents.

- 3780 Kilroy Airport Way Suite 200 Long Beach, CA 90806
- 562-725-6033
- support@geonomics.us